> ## Documentation Index
> Fetch the complete documentation index at: https://agno-v2-codex-docs-audit-20260719-0149.mintlify.site/llms.txt
> Use this file to discover all available pages before exploring further.
# Agent Observability
> Store OpenTelemetry traces and spans in your configured database.
AgentOS comes with a built-in tracing provider that routes every run to your own database. There's no observability service to sign up for and no tracing API key to manage.
```python theme={null}
from agno.os import AgentOS
agent_os = AgentOS(
agents=[agent],
db=db,
tracing=True,
)
```
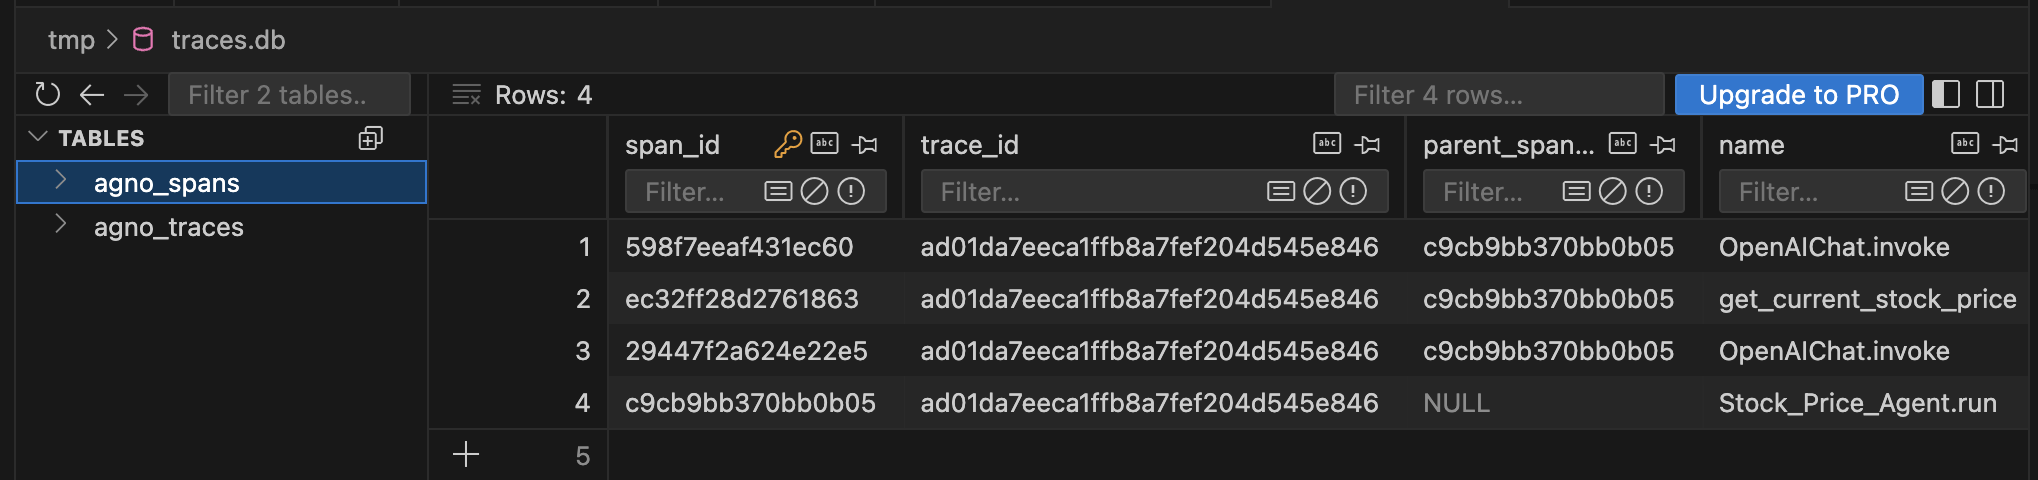
`tracing=True` turns on OpenTelemetry instrumentation for agent, team, and workflow runs. Every run produces a trace tree: spans for the LLM call, each tool, team delegation, and workflow step. The database exporter writes the aggregate trace to `agno_traces` and individual spans to `agno_spans`.
## Where trace data goes
The built-in exporter writes trace records to the database you configure:
| Configuration | Trace destination |
| ------------------------------------------------ | --------------------------------------------------------- |
| `AgentOS(db=trace_db, tracing=True)` | `trace_db` |
| `AgentOS(tracing=True)` with component databases | First database found on a native agent, team, or workflow |
| `AgentOS(tracing=True)` with no database | Tracing is skipped and AgentOS logs a warning |
| Custom OpenTelemetry exporter | The exporter destination you configure |
Tracing does not change where models and tools send data. An agent can still call external model providers, tools, or exporters. Trace attributes can contain prompts, tool arguments, and model output, so apply the same access and retention controls you use for other sensitive application data.
 ## What gets captured
Each record in `agno_spans` stores the span name, parent, status, timestamps, duration, and an `attributes` JSON object. The aggregate row in `agno_traces` stores the run, session, user, and component IDs when present, plus overall status, start and end times, and duration.
Traces follow OpenInference semantic conventions, so you can query them directly:
```sql theme={null}
-- Top 10 slowest span types by average duration
SELECT
name,
AVG(duration_ms) AS avg_ms,
COUNT(*) AS calls
FROM ai.agno_spans
GROUP BY name
ORDER BY avg_ms DESC
LIMIT 10;
```
`PostgresDb` creates its tables in the `ai` schema by default (override with `PostgresDb(db_schema=...)`). Qualify the table as `ai.agno_spans` or add `ai` to your `search_path`.
## In the AgentOS UI
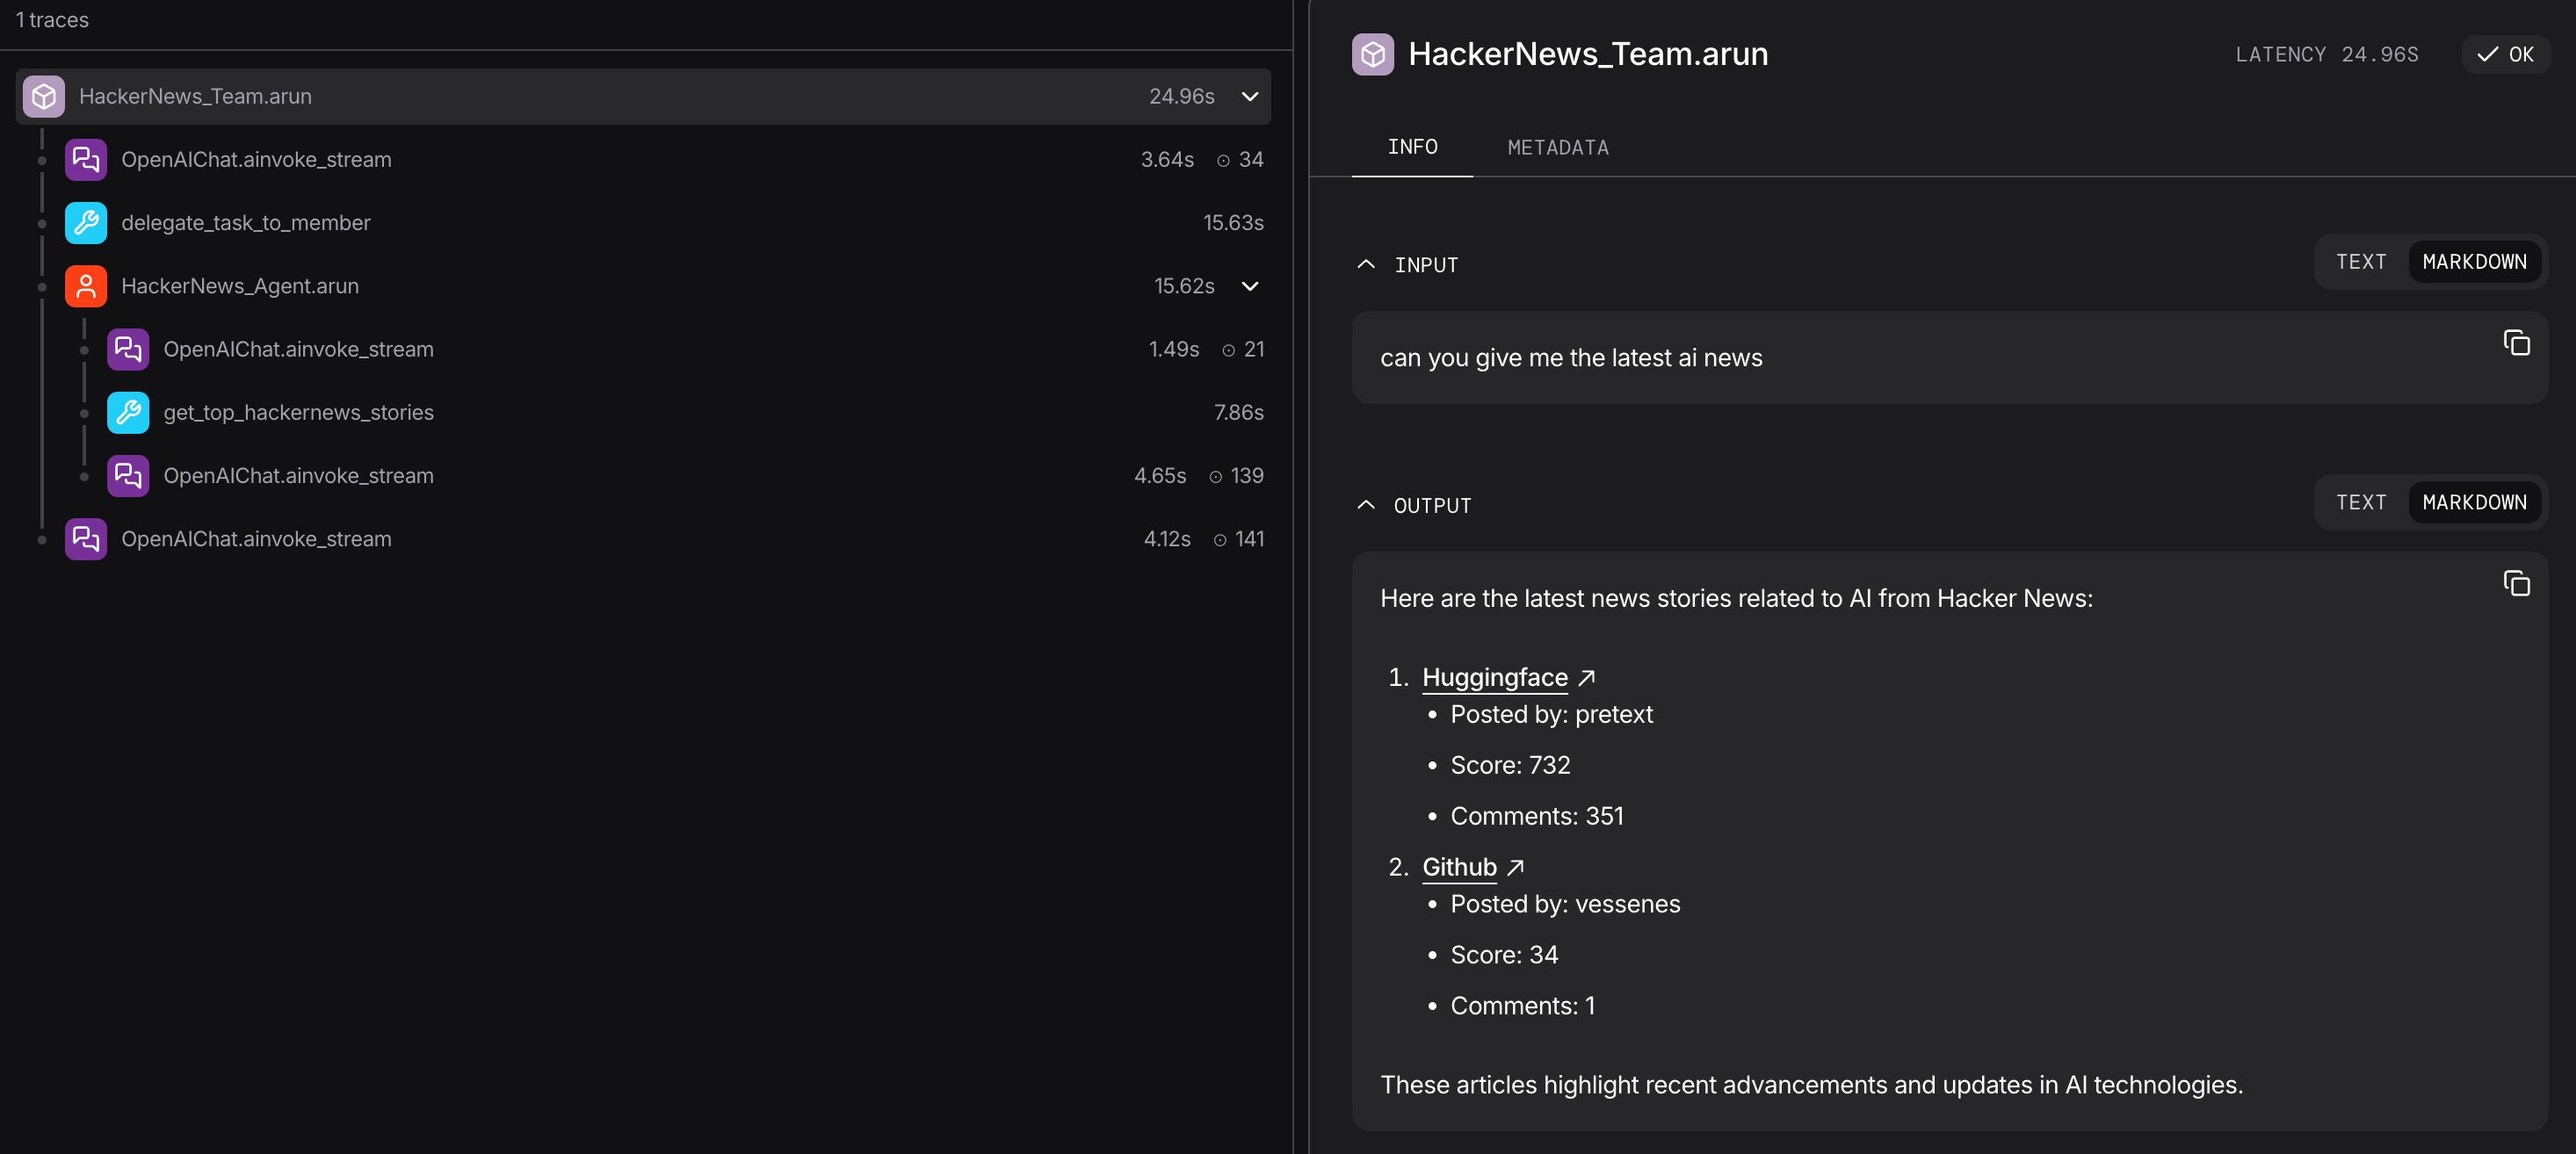
The [control plane](https://os.agno.com) renders the same traces visually. Click a run to see the full tree: LLM hops, tool calls with their inputs and outputs, and sub-agent traces. Filter by user, session, or time range.
## What gets captured
Each record in `agno_spans` stores the span name, parent, status, timestamps, duration, and an `attributes` JSON object. The aggregate row in `agno_traces` stores the run, session, user, and component IDs when present, plus overall status, start and end times, and duration.
Traces follow OpenInference semantic conventions, so you can query them directly:
```sql theme={null}
-- Top 10 slowest span types by average duration
SELECT
name,
AVG(duration_ms) AS avg_ms,
COUNT(*) AS calls
FROM ai.agno_spans
GROUP BY name
ORDER BY avg_ms DESC
LIMIT 10;
```
`PostgresDb` creates its tables in the `ai` schema by default (override with `PostgresDb(db_schema=...)`). Qualify the table as `ai.agno_spans` or add `ai` to your `search_path`.
## In the AgentOS UI
The [control plane](https://os.agno.com) renders the same traces visually. Click a run to see the full tree: LLM hops, tool calls with their inputs and outputs, and sub-agent traces. Filter by user, session, or time range.
 ## Multi-database tracing
Traces are high-volume and write-heavy, with a different cost profile, retention, and access pattern than sessions. For production, route them to a dedicated database by pointing the AgentOS `db` at it:
```python theme={null}
from agno.agent import Agent
from agno.db.postgres import PostgresDb
from agno.models.openai import OpenAIResponses
from agno.os import AgentOS
# Each agent keeps its own database
agent_db = PostgresDb(db_url="postgresql+psycopg://primary/...")
# Dedicated database for traces
trace_db = PostgresDb(db_url="postgresql+psycopg://traces/...")
agent = Agent(name="Research Agent", model=OpenAIResponses(id="gpt-5.2"), db=agent_db)
agent_os = AgentOS(
agents=[agent],
db=trace_db, # All traces are written here
tracing=True,
)
```
The AgentOS `db` is where traces land. Keeping it separate isolates trace write volume from your agent data and gives you independent retention and scaling.
See [Multi-DB tracing](/agent-os/tracing/usage/tracing-with-multi-db-scenario) for the `setup_tracing()` variant with batch tuning.
## External providers
You can configure OpenTelemetry exporters for Langfuse, LangSmith, Arize, Logfire, MLflow, The Context Company, or another OpenTelemetry endpoint.
See the [Observability section](/observability/overview): [Langfuse](/observability/langfuse), [LangSmith](/observability/langsmith), [Arize](/observability/arize), [Logfire](/examples/integrations/observability/logfire-via-openinference), [MLflow](/observability/mlflow), [The Context Company](/observability/the-context-company).
## Developer Resources
* [Tracing overview](/tracing/overview)
* [Tracing in AgentOS](/agent-os/tracing/overview)
* [Query traces from your database](/tracing/db-functions)
## Multi-database tracing
Traces are high-volume and write-heavy, with a different cost profile, retention, and access pattern than sessions. For production, route them to a dedicated database by pointing the AgentOS `db` at it:
```python theme={null}
from agno.agent import Agent
from agno.db.postgres import PostgresDb
from agno.models.openai import OpenAIResponses
from agno.os import AgentOS
# Each agent keeps its own database
agent_db = PostgresDb(db_url="postgresql+psycopg://primary/...")
# Dedicated database for traces
trace_db = PostgresDb(db_url="postgresql+psycopg://traces/...")
agent = Agent(name="Research Agent", model=OpenAIResponses(id="gpt-5.2"), db=agent_db)
agent_os = AgentOS(
agents=[agent],
db=trace_db, # All traces are written here
tracing=True,
)
```
The AgentOS `db` is where traces land. Keeping it separate isolates trace write volume from your agent data and gives you independent retention and scaling.
See [Multi-DB tracing](/agent-os/tracing/usage/tracing-with-multi-db-scenario) for the `setup_tracing()` variant with batch tuning.
## External providers
You can configure OpenTelemetry exporters for Langfuse, LangSmith, Arize, Logfire, MLflow, The Context Company, or another OpenTelemetry endpoint.
See the [Observability section](/observability/overview): [Langfuse](/observability/langfuse), [LangSmith](/observability/langsmith), [Arize](/observability/arize), [Logfire](/examples/integrations/observability/logfire-via-openinference), [MLflow](/observability/mlflow), [The Context Company](/observability/the-context-company).
## Developer Resources
* [Tracing overview](/tracing/overview)
* [Tracing in AgentOS](/agent-os/tracing/overview)
* [Query traces from your database](/tracing/db-functions)